streamlit – The fastest way to build and share data apps 是专门针对机器学习和数据科学团队的应用开发框架,你可以认为它的目标是取代Flask在机器学习项目中的地位从而帮助机器学习工程师快速开发用户交互工具。
源码传送门: https://github.com/streamlit/streamlit
关于streamlit的介绍和教程网上可以搜到,不再做过多的冗余介绍,当然本篇依旧是入门篇,不过我们会用实际的数据来看一下它基本的效果。我们要用DogeCoin狗狗币的历史数据来画一些有意思的图,并利用streamlit来展示出来,整个过程也是对streamlit的初步认识。废话不多说,开始撸代码。
1、安装
pip install streamlit
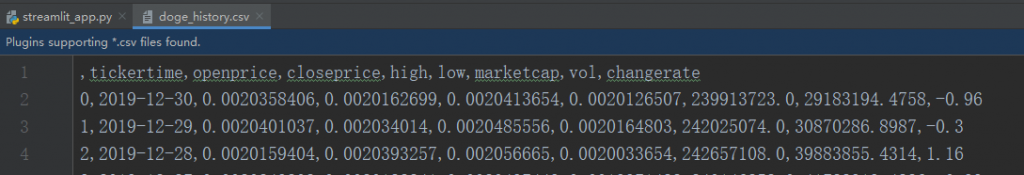
2、狗狗币数据一览
3、引入相关python包
import streamlit as st
import pandas as pd
import plotly.graph_objects as go
4、自定义函数
# 加载数据
def load_dogecoin_data():
    ss = pd.read_csv("D:/path/to/dogecoin/doge_history.csv")
    ss = ss.set_index(pd.DatetimeIndex(ss['tickertime']))
    ss = ss.drop(columns=['Unnamed: 0', 'tickertime'])
    ss = ss.sort_index()
    return ss

# 设置开始结束日期
def get_inputs():
    # 设置边框输入栏
    start_date = st.sidebar.text_input("开始日期:", "2019-12-01")
    end_date = st.sidebar.text_input("结束日期:", "2021-05-16")
    return start_date, end_date

# 按日期加载数据
def get_data(start, end):
    data = load_dogecoin_data()
    start = pd.to_datetime(start)
    end = pd.to_datetime(end)
    return data.loc[start: end]
5、数据初始化
_start, _end = get_inputs()
df = get_data(_start, _end)
6、各种画图
fig = go.Figure(data=[go.Candlestick(
x=df.index,
open=df['openprice'],
close=df['closeprice'],
high=df['high'],
low=df['low'],
increasing_line_color='red',
decreasing_line_color='green'
)])
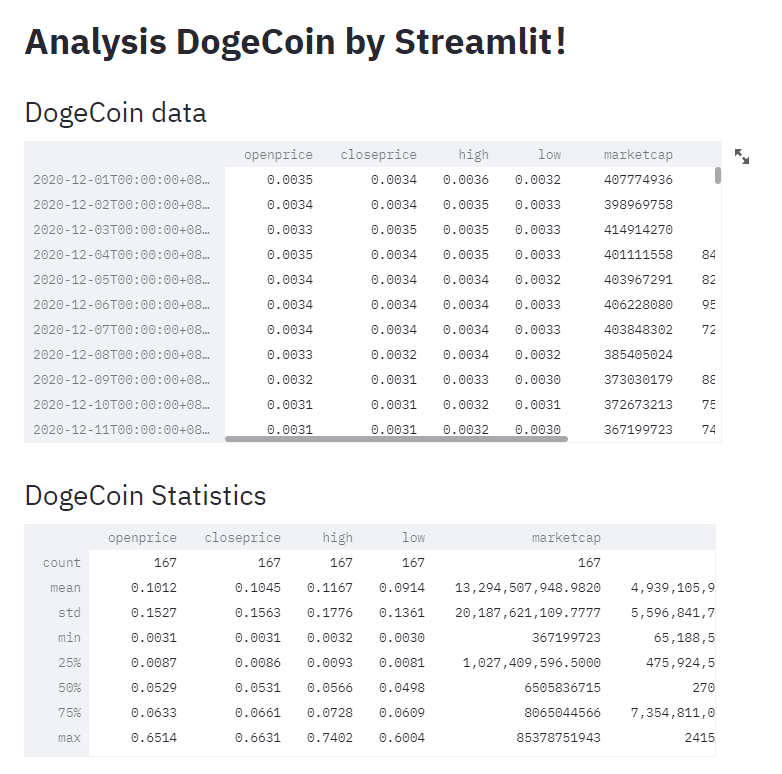
st.title('Analysis DogeCoin by Streamlit!')
st.header('DogeCoin data')
st.write(df)
st.header('DogeCoin Statistics')
st.write(df.describe())
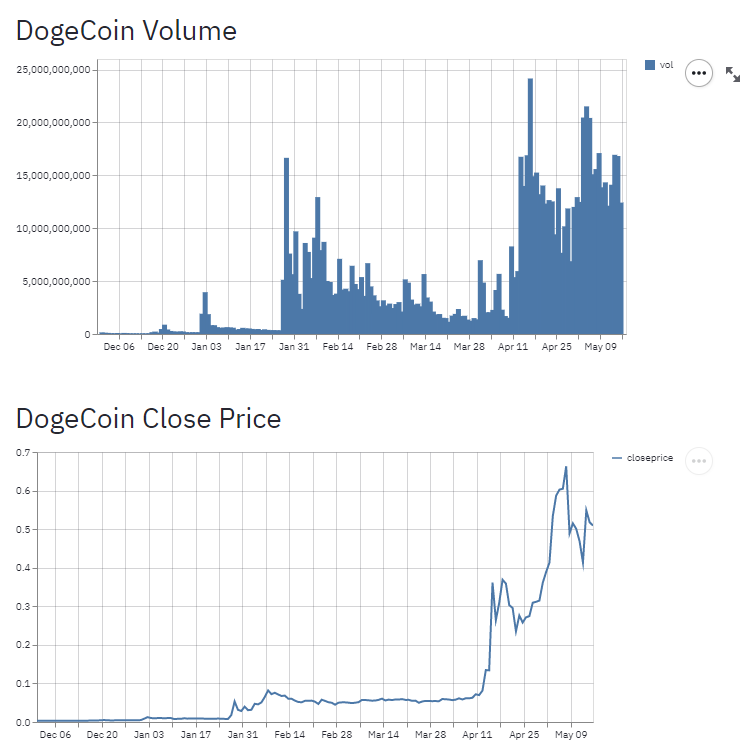
st.header('DogeCoin Volume')
st.bar_chart(df['vol'])
st.header('DogeCoin Close Price')
st.line_chart(df['closeprice'])
st.header('DogeCoin Candle Stick')
st.plotly_chart(fig)
7、运行
streamlit run streamlit_app.py
8、效果展示
我们可以在浏览器中看到运行的效果,打开浏览器输入地址,http://localhost:8501/
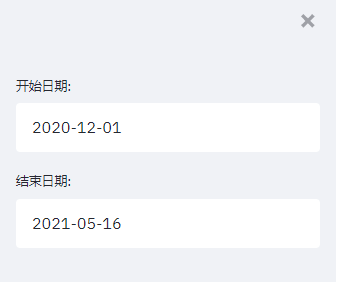
在浏览器的左侧边框可以看到初始化的文本框,我们可以自己手动输入日期,然后按回车,那么浏览器对应的其它图会自动从新加载指定日期的数据。
整个浏览器中看到的图都是动态的,可以通过鼠标滚动或者单击挪动图的具体内容。
参考: https://zhuanlan.zhihu.com/p/85741306
![静态工厂模式-创建型设计模式 [PHP]](https://www.lifefunker.com/wp-content/themes/dashscroll/img/thumb-medium.png)
近期评论